How to Read a Pump Curve: A Practical Guide to Flow, Head, and Efficiency
To understand how to read a pump curve, start with the correct model and speed, find your required flow, and trace across to the head the pump can produce. That gives you a useful first check. Efficiency, power, and suction conditions then help you decide whether that point is suitable.
Today, we’ll work through a centrifugal pump’s published data, so you can follow the same checks on your own sheet. In this guide, you’ll learn a practical method for reading a pump curve. Then we’ll apply it to a real Grundfos booster and check the numbers together.
TL;DR
- Match the curve to the exact pump, speed, impeller, and liquid conditions before taking readings.
- Find your required flow, trace up to the correct head curve, then across to the head scale.
- Check efficiency at that flow and stay within the manufacturer’s operating limits around BEP.
- Read shaft power separately from electrical consumption, and check the motor across your intended operating range.
- Compare available suction head with the published requirement and the appropriate margin.
- Use formulas to check units and power. Confirm control settings and system requirements before choosing a pump. The chart alone cannot establish your installed flow rate.
What Is a Pump Curve?
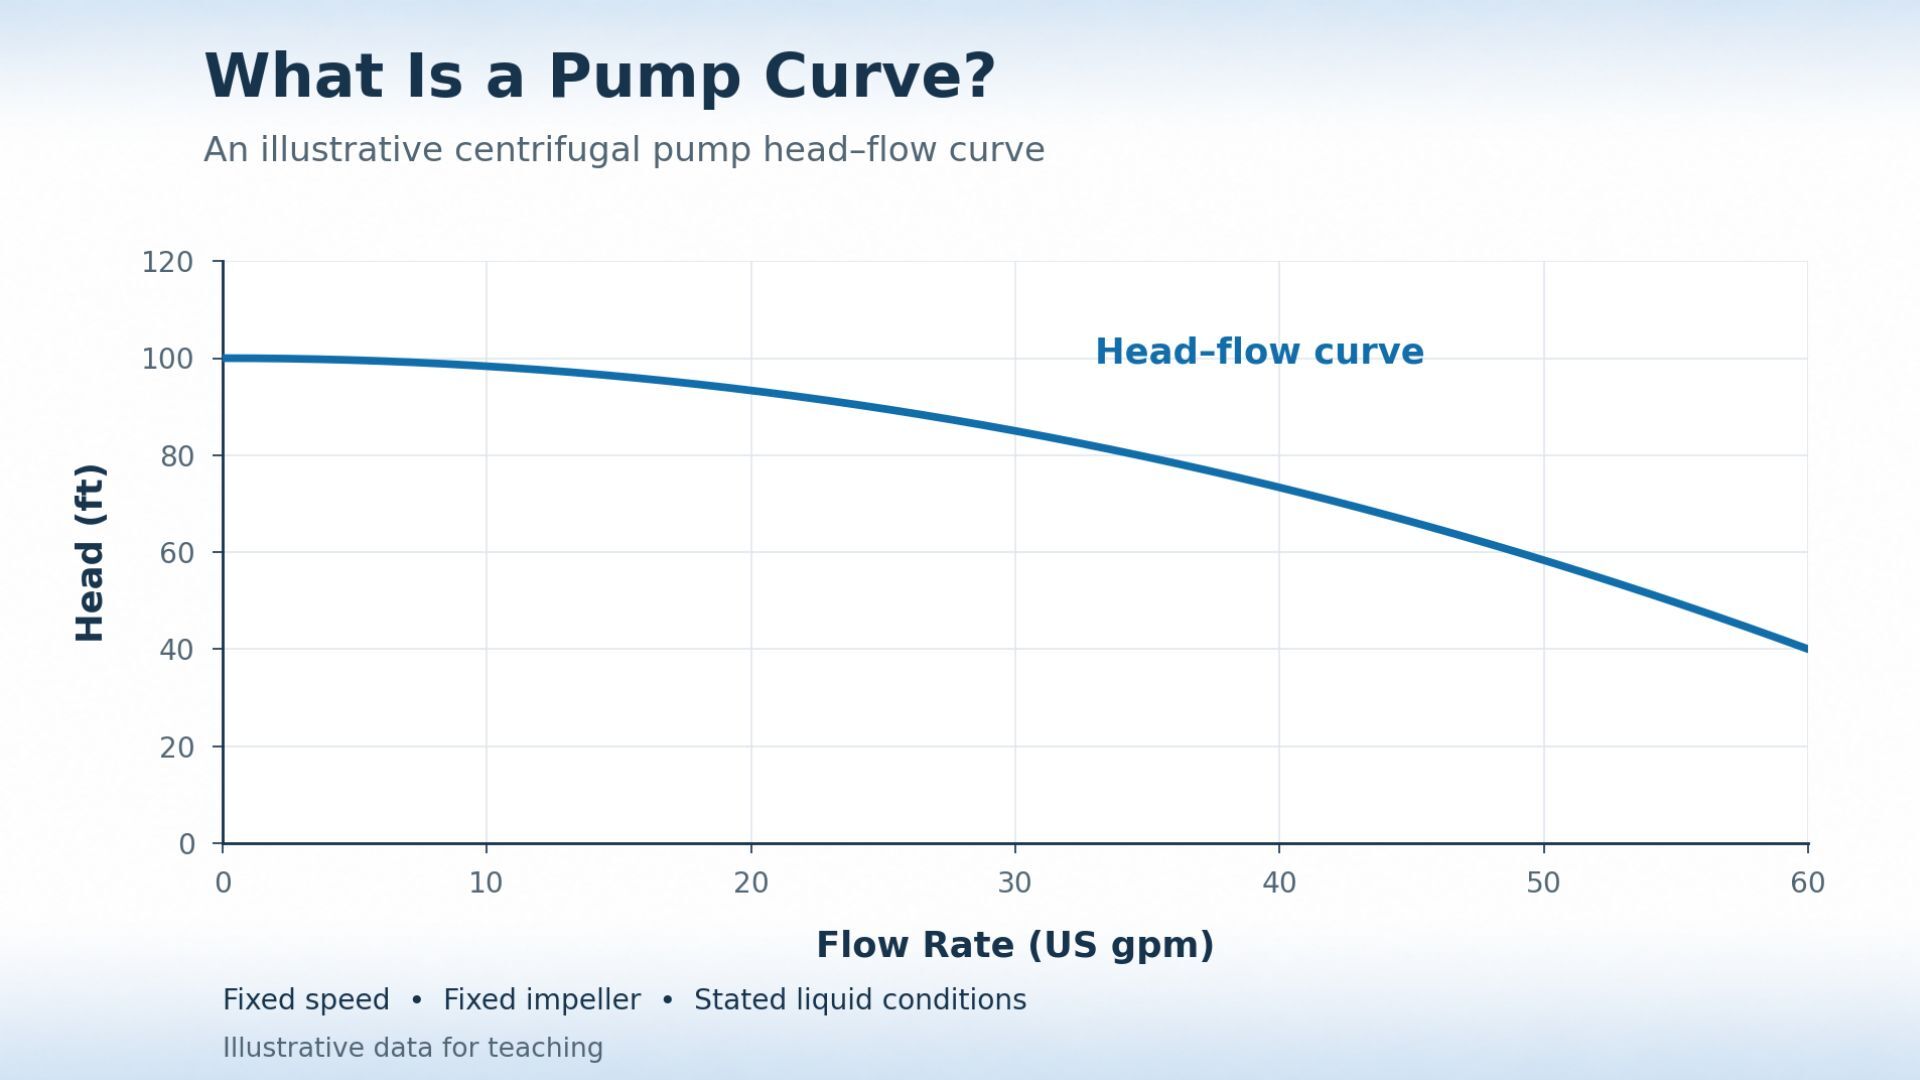
A pump curve is a manufacturer’s graph showing how much head a pump develops at different flow rates under stated conditions. Head is the energy the pump adds per unit weight of liquid, expressed as an equivalent height in feet or meters.
We treat each curve as a description of one configuration. Change the speed, impeller, or liquid properties, and the applicable performance can change too. The basic relationship looks like this.
How to Read a Pump Curve Step by Step
We keep one flow value in view throughout the sheet. That prevents us from pairing a head reading with efficiency or power from somewhere else. Here’s the sequence.
1. Choose the Correct Pump Curve Chart
You can start with the model number and legend. Check rotational speed, impeller diameter or number of stages, supply frequency, and the liquid and temperature used for the published data.
Several lines can belong to the same pump. For example, the Grundfos UPS 15-58 FC three-speed circulator has separate speed curves. Its brochure also distinguishes performance with and without a check valve.
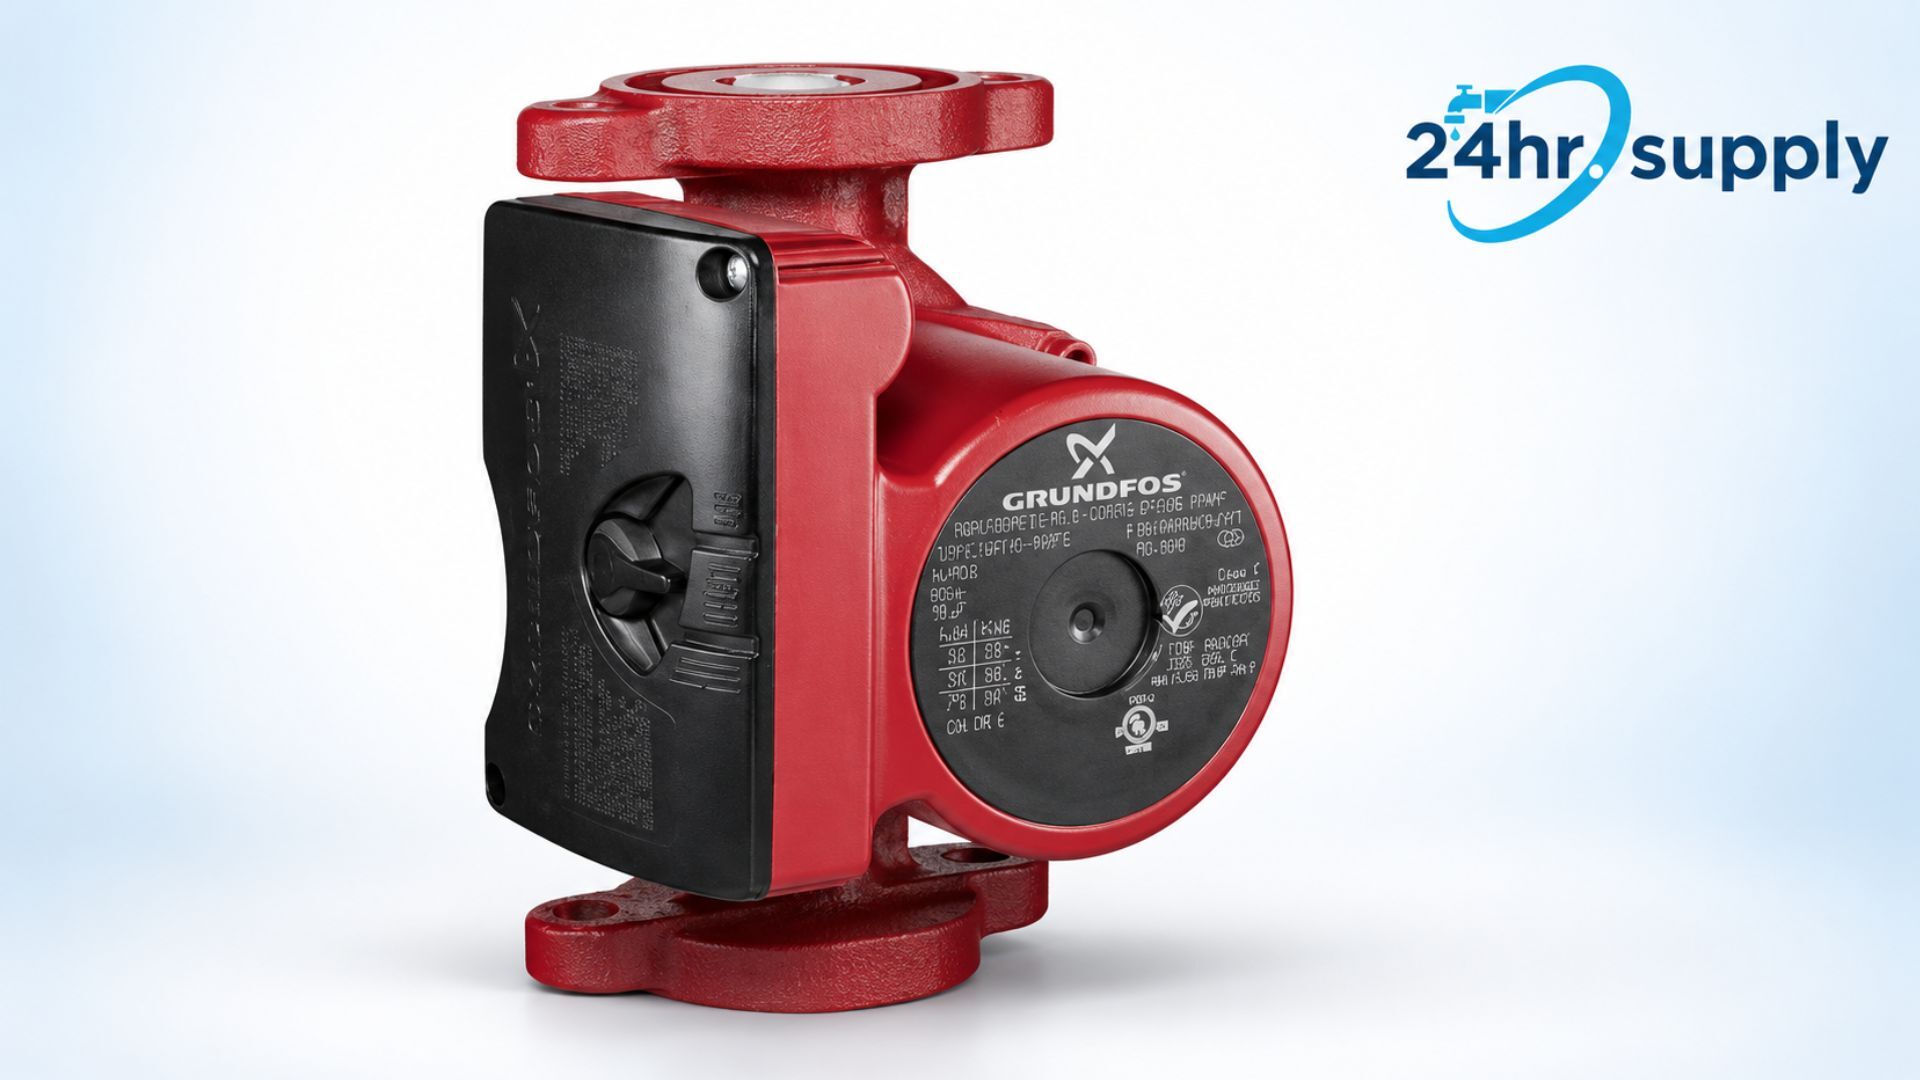
Choose the line that matches your setup before comparing numbers. Check the units before comparing sheets from different manufacturers. A water curve also needs correction or manufacturer confirmation for a significantly more viscous liquid.
We’ll cover automatic control modes separately below.
2. Trace the Required Flow and Head
Flow usually runs horizontally, but head runs vertically. You mark the required flow, trace upward to the selected curve, then move sideways to read head. Compare the pump curve performance data with your required head.
Shutoff means zero flow, and runout is the high-flow end. Neither endpoint should be treated as a normal operating target. Maximum head and maximum flow occur at different points. The casing’s pressure rating limits allowable pressure inside the housing.
For a Zoeller M53 sump pump, account for discharge lift and pipe losses. Wastewater applications add sewage pump sizing considerations such as solids handling. Rising and falling water balance in a filled closed loop, so building height itself adds no circulating head.
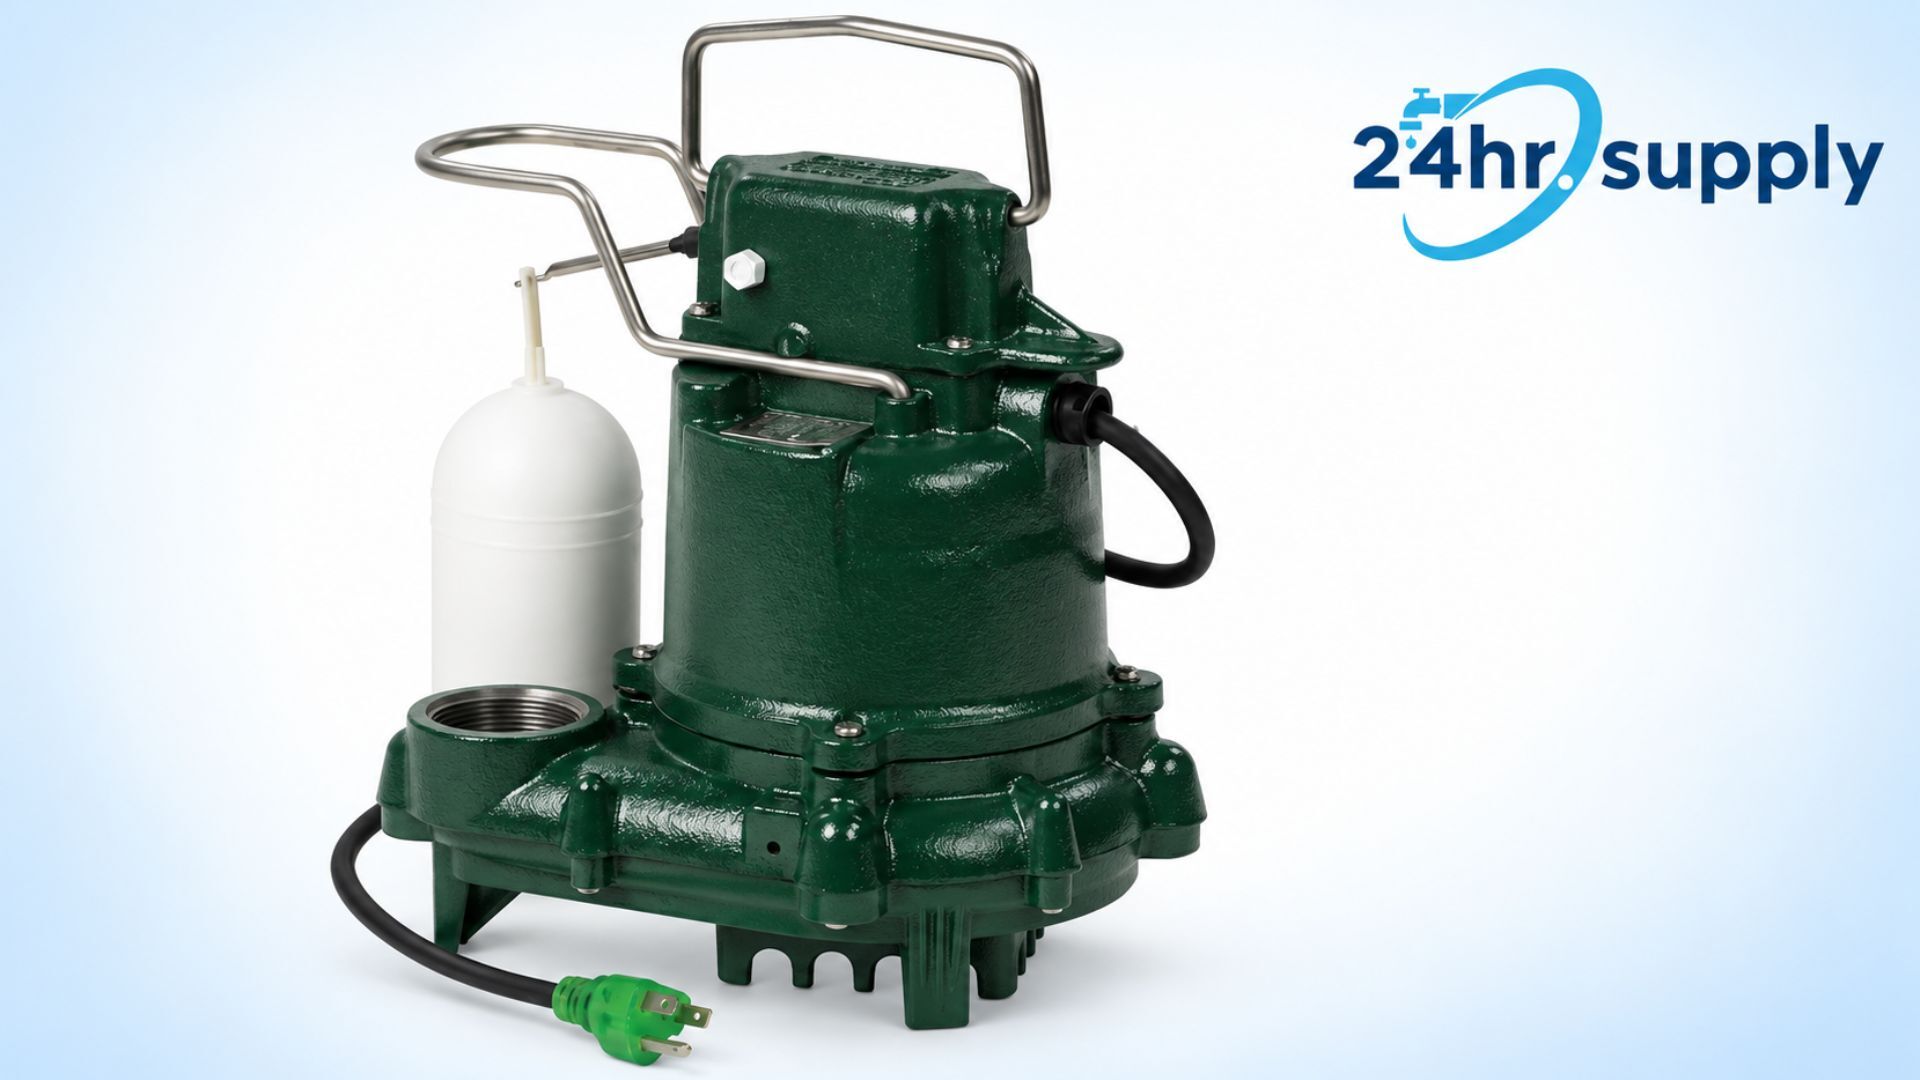
Keep in mind that the marked requirement remains your target. The actual operation also depends on the system.
3. Read Pump Curve Efficiency and Locate BEP
The best efficiency point, or BEP, is where pump efficiency peaks for the selected configuration. We read efficiency at our chosen flow first, then compare its position with BEP. The highest percentage elsewhere on the sheet tells us little about that particular duty.
The Hydraulic Institute describes preferred operating regions ranging from 90%-110% to 70%-120% of BEP flow. The range depends on the pump’s specific speed. Those percentages measure flow relative to BEP. They aren’t efficiency ratings, and the manufacturer’s limits govern the actual selection.
Find your selected head and flow on the efficiency map. Read the labeled contour if the point lies on one, or estimate between neighboring contours if it falls between them. Check whether the efficiency curve represents the pump alone or includes motor and drive losses. Use pump-only efficiency in the shaft-horsepower formula.
The illustration below makes the distinction between your reading and the peak easier to see.
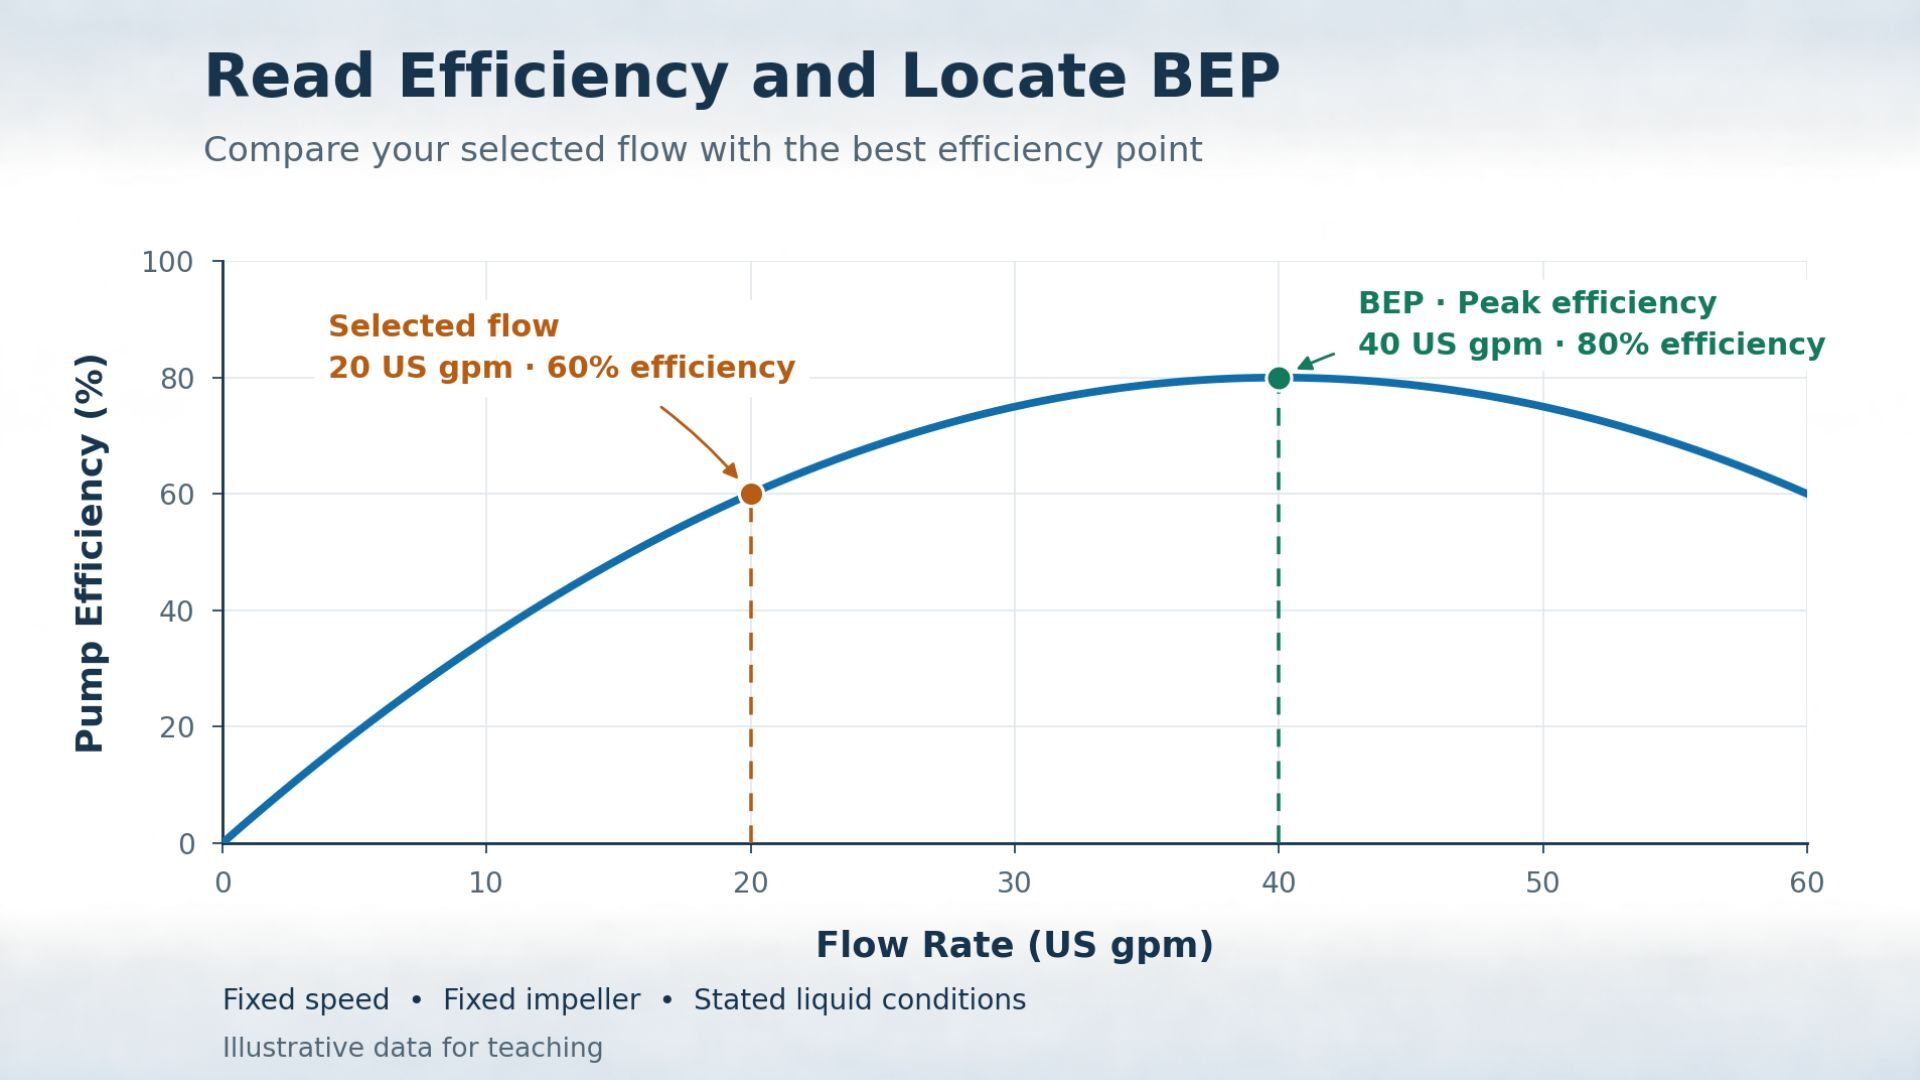
The selected flow is a reading example. At 60% of BEP flow, it falls outside the preferred operating ranges discussed here.
4. Read Pump Curve Power and Check the Motor
From the same flow, we move to the power plot and follow the matching speed or configuration. Read its units carefully because charts can use horsepower or kilowatts.
On the Grundfos sheet we’ll use below, P2 is motor output delivered to the pump shaft. P1 is electrical input to the motor and drive. Their losses explain the difference.
Next, the motor’s rated output is a capacity figure. The plotted demand can be lower, and it changes along the curve. So, check the intended operating range for overload risk. Below, the shared flow marker connects the power reading with the suction check that follows.
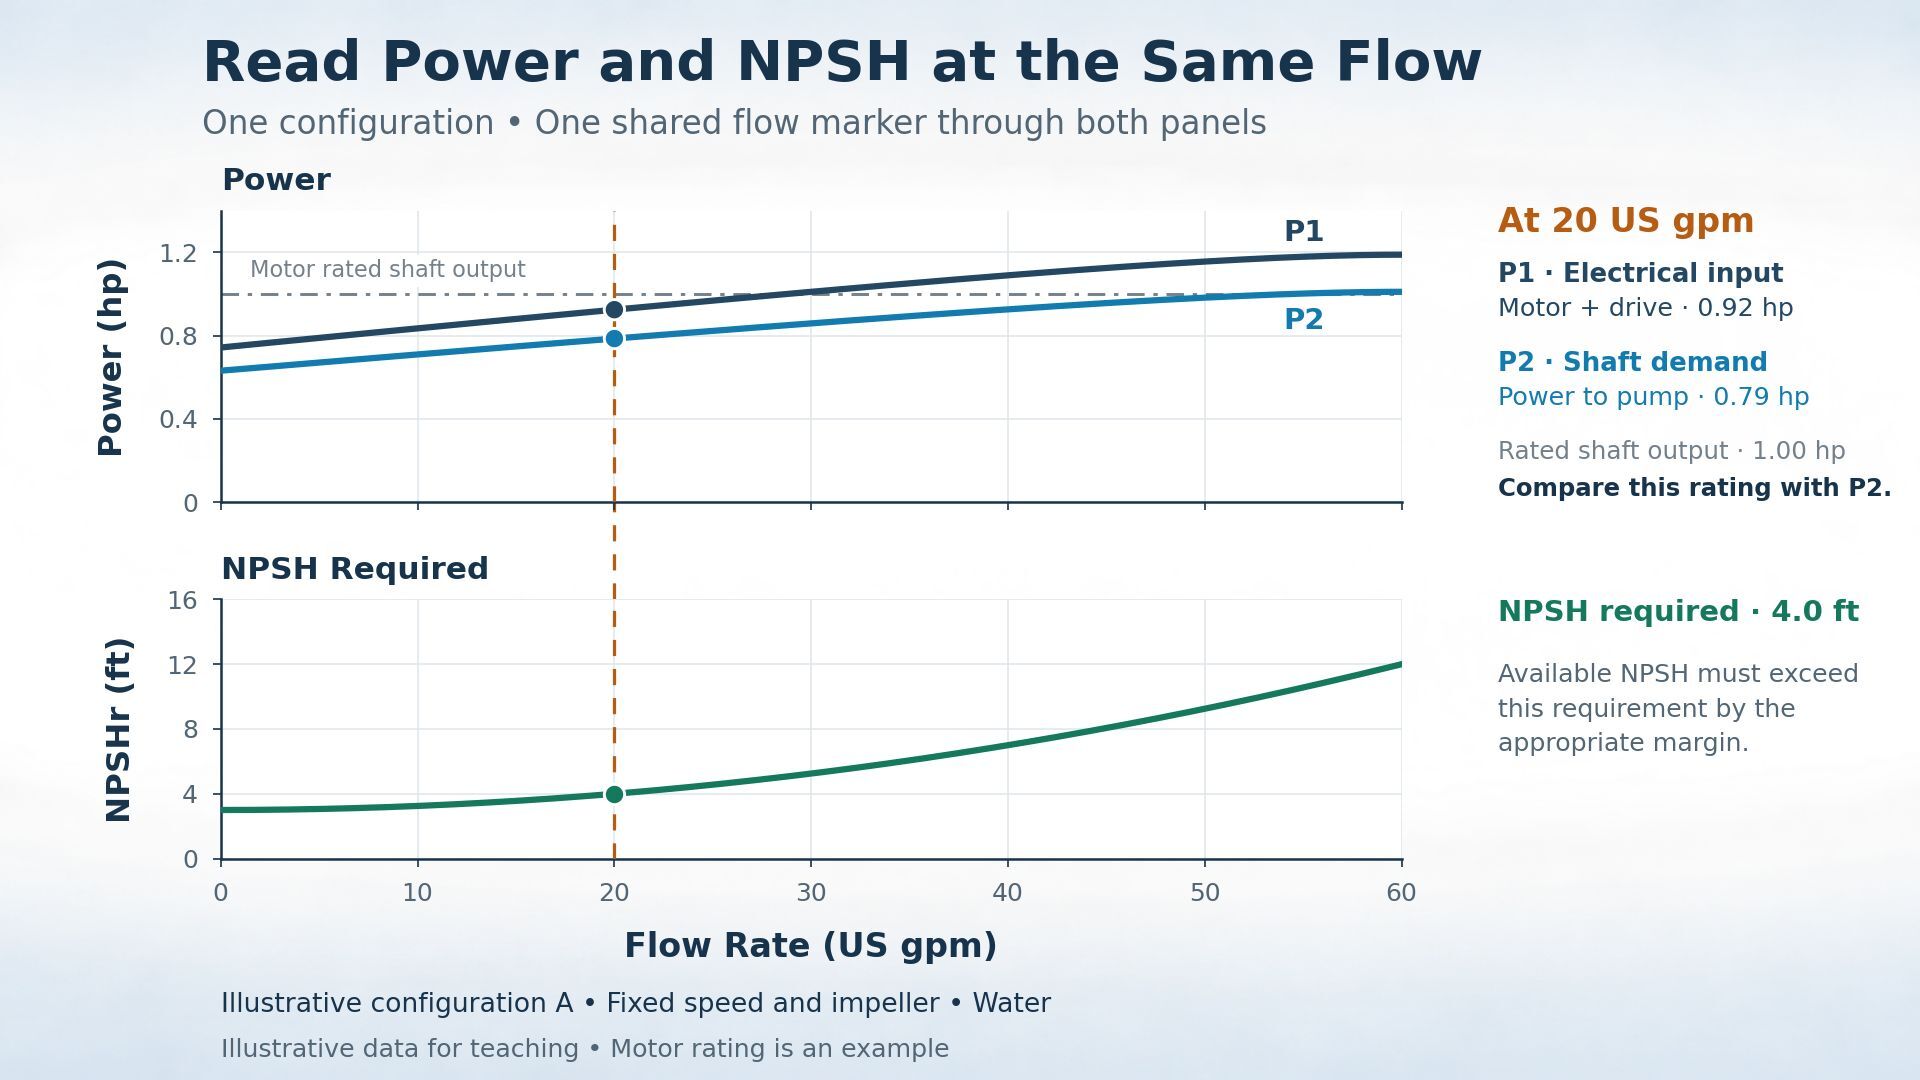
5. Check NPSH and the Suction Conditions
Net positive suction head available, or NPSHa, is total absolute suction head minus vapor-pressure head at the pump’s reference level. NPSHr is the manufacturer’s published requirement for specified conditions. You can check that available head exceeds it by the appropriate margin.
Hotter liquid, suction lift, and inlet losses can reduce what’s available. NPSH therefore needs more than a measurement of how far the pump sits above the water.
NPSH3 is the available NPSH at which cavitation causes a 3% reduction in pump head at a specified flow and speed. For a multistage pump, that reduction refers to the first-stage head. Use the manufacturer’s published NPSH requirement and the appropriate margin for the application.
If suction data is missing, request it from the manufacturer. For poor flow, noise, air, or restrictions, our Grundfos pump troubleshooting guide covers additional checks.
Which Pump Curve Formula Do You Need?
You need the equation that matches your check, such as converting pressure difference into head or estimating shaft horsepower. We use these calculations to make the chart’s numbers comparable.
Here are the two useful starting points:
|
Check |
Formula |
Inputs and Limits |
|---|---|---|
|
Pressure difference to pressure head |
H ≈ 2.31 × Δp / SG |
H in feet; Δp in psi. Total pump head can also include velocity and elevation differences. |
|
Pump shaft horsepower |
HP = Q × H × SG / (3960 × ηp) |
Q in US gpm; H in feet; ηp is pump efficiency as a decimal at the selected duty. |
SG means specific gravity, approximately 1 for water near room temperature. For a pump curve calculation, use flow, head, and efficiency from the same operating condition. But for the formula, use efficiency as a decimal, so 60% becomes 0.60. In the calculator below, enter 60 in the efficiency (%) field.
The horsepower result estimates shaft demand. Electrical input also depends on motor and drive efficiency. Neither equation generates the manufacturer’s complete performance curve from a single rating.
Pump Curve Example With a Real Booster Pump
We checked the Grundfos CMBE 1-44 booster pump, product 98548109, against its specification sheet dated April 14, 2022. This identifies the 200-240 V variant and gives us a documented starting point.
Here are the values we can check directly:
|
Source Value |
Interpretation |
Check |
|---|---|---|
|
Rated flow of 10.6 US gpm |
The manufacturer’s stated reference flow |
Locate 10.6 on the horizontal axis. |
|
Rated head of 94.16 ft |
Head at the stated rated condition |
Compare with the applicable head curve. |
|
Calculated equivalent of about 40.8 psi |
94.16 ÷ 2.31, with SG = 1 |
Treat this as a pressure-head equivalent. |
The rated values come from the manufacturer’s sheet, but the pressure conversion is our calculation.
That last number needs care. Discharge gauge pressure also depends on inlet pressure and installation conditions, so 40.8 psi isn’t a promised outlet reading.
When we examined page 3, the blue percentage labels identified speed curves. Efficiency has its own scale on the right. Confusing those labels would produce a completely wrong efficiency reading.
Follow the selected flow through the matching P1, P2, and NPSH curves too. The annotated sheet below shows that route.
We still need the installation’s required duty and suction conditions before assessing suitability.
Check How the Pump Is Controlled
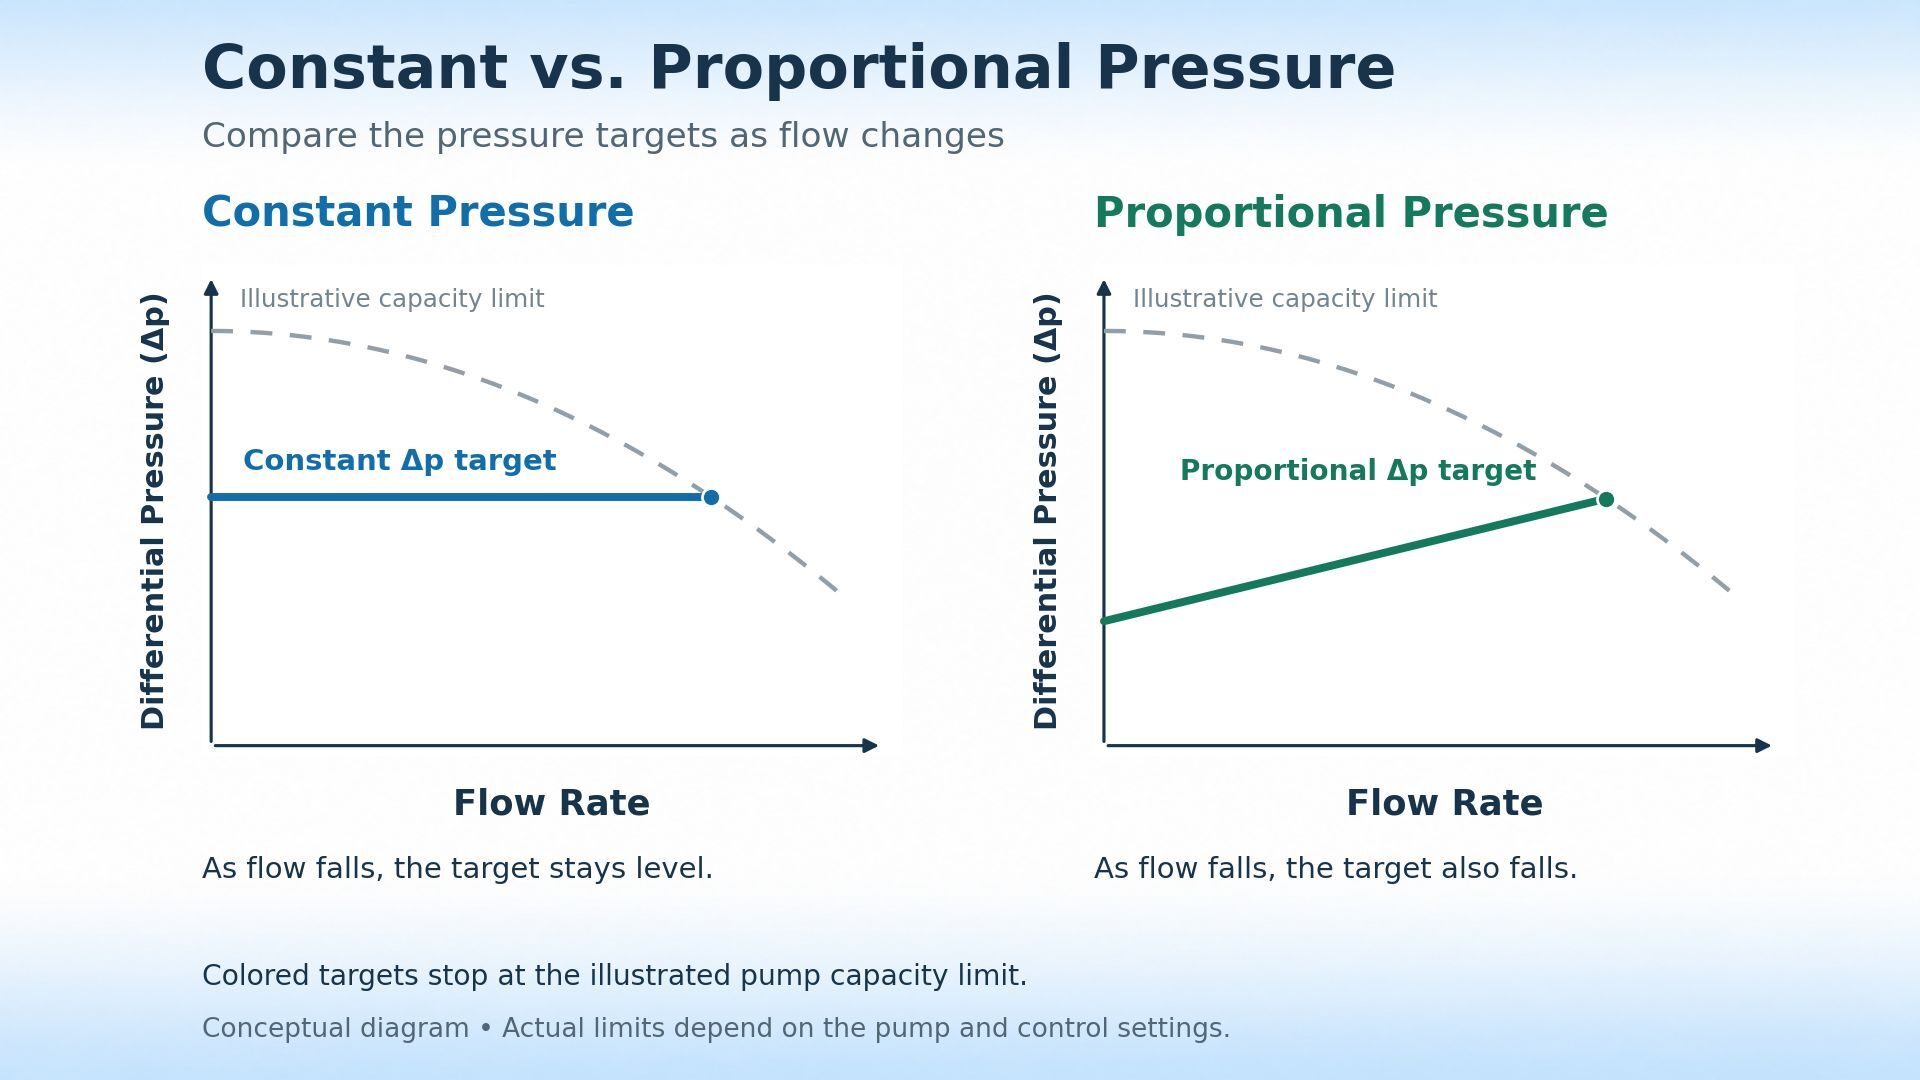
A controller can change speed as demand changes. You can check the selected mode because that setting determines how the pump responds. Here are two modes available on the Grundfos ALPHA 15-58 F circulator:
- Constant pressure holds approximately the same differential pressure as flow changes, within the pump’s operating limits.
- Proportional pressure reduces the differential-pressure target as flow falls, so the control line slopes instead of staying level.
The sketches below show those target lines but actual performance remains bounded by the pump’s capacity.
For residential boosting, our comparison of SCALA1 versus SCALA2 booster pump controls explains another control choice that affects selection.
Do You Need a Pump Curve Calculator?
You can read a chart without a calculator, but one helps you check conversions and power estimates. We use the calculations above for those specific jobs.
Use the tool below to convert pressure and head or estimate shaft horsepower. Enter consistent units, specific gravity, and the relevant flow, head, and efficiency. These checks require documented pump data. Horsepower alone cannot generate a curve, and predicting installed flow also requires system information.
24hr Supply · Pump calculation tools
Pressure, head & shaft power
Convert a pressure difference into head, or estimate shaft power using readings from the same point on your pump curve.
Loading calculator… If this message stays, JavaScript may be blocked. The formulas in this article can be used for manual calculations.
Use the Curve to Compare Pumps at 24hr Supply
Once you know how to read a pump curve, you can narrow your search using the duty your installation requires. At 24hr Supply, we carry booster pumps, heating circulators, and drainage pumps, with product information and specification sheets to help you compare options.
Start with the application, then bring the flow and head requirements to the relevant listing. We recommend keeping the exact model number alongside your calculations so the electrical supply, connections, and control settings stay tied to the pump you’re considering.
Our team can help you locate a specification sheet and check the listed voltage and connection details. Just make sure to have your product number and system requirements handy when you ask 24hr Supply about the pump specifications .
FAQs
How to Read a Pump Curve Diagram?
Read between plotted points by estimating locally between the nearest known values. We use interpolation for an approximate reading when a pump curve graph lacks an exact label. Stay inside the published range, and avoid reporting more precision than the chart supports.
How to Read a Pump Curve (Grundfos)?
Start with the pump curve Grundfos provides for your exact product number. You can check that number before downloading the specification sheet, then match its voltage and configuration. A shared family name can cover several different versions of a pump.
What Is the Difference Between a System Curve and a Pump Curve?
A pump curve shows the head the pump delivers at each flow, but a system curve shows the head the installation requires. For a fixed-speed pump in a passive system, you’ll find the operating point where those curves intersect. Changes to piping or valve positions can move that point.
Recent Posts
-

How to Read a Pump Curve: A Practical Guide to Flow, Head, and Efficiency
To understand how to read a pump curve, start with the correct model and speed, find your required f …Nov 16th 2026 -
How to Bleed a Grundfos Pump: Everything You Need to Know in ONE Place!
How to bleed a Grundfos pump depends on its design, with either a documented manual vent point or a …Nov 10th 2026 -
What Is a Pressure Transducer? How It Works in Modern HVAC and Plumbing Systems
How does a pump or HVAC controller know when pressure changes? The answer starts with a small compon …Oct 25th 2026